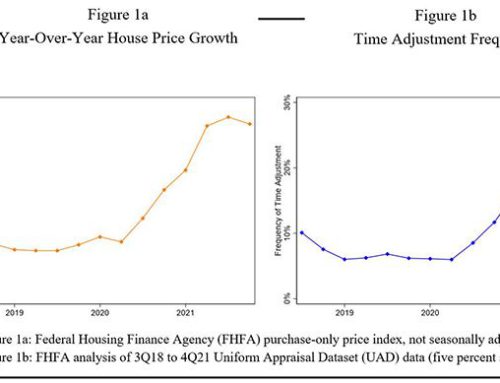
New GSE Requirements:
As the Feb 4th deadline approaches, I have been thinking more and more about this. I’ve always been an advocate of making date of sale adjustments when warranted. But I have always looked at trends on an annualized basis; what is the general market showing me over the past year? Two years? Maybe, with enough data, I can see something relevant based on quarterly data. But monthly? In my experience, there is very rarely enough data to make an adjustment. You either have to consider a wider market area which can often skew the results, or base your adjustments on a very limited amount of sales.
Here is an example. I recently completed an appraisal here in Austin in a sought-after area near downtown generally referred to as Rollingwood. Here is what I consider the actual Rollingwood area:

Rollingwood was built out in the 1950’s through 1970’s with what I would call average- to good quality homes that average around 2,500sf. These have a median sales price of $1.8M. But due to its location close to downtown Austin buyers are purchasing these older homes and razing them for new construction, so there are a lot of REALLY nice newer homes here. These newer homes average 3,900sf and have a median sales price of $3.6M. Obviously, two very different groups.
So the first question is, do I use all homes (old and new) in this area over the past 12 months to determine date of sale variances? Because that results in a total of 15 sales.
Here is what that charge would look like:
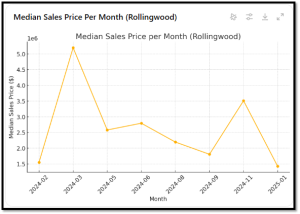
Based on this, should I make a negative 46% ($1.4M today vs. $2.6M in May) Date of Sale adjustment for my comparable sale that closed in May of 2024? Probably not. There are some new construction sales that aren’t comparable and shouldn’t be included in the data.
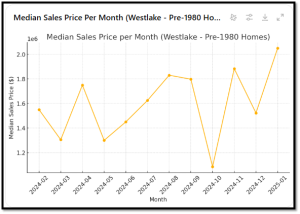
So let’s limit our data to only homes built prior to 1980, like the one I am working on. Now I have only 9 matches that are spread over 12 months.
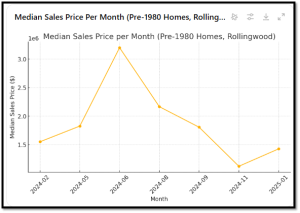
So now I have slightly more meaningful data, but I’m comparing only ONE sale in May of last year to one sale in the current market. About $1.4M median price now vs. $1.9M then. Is a 26% downward adjustment supported? No, probably not. One vs. one is not a sufficient data set. There could be lot size, quality, condition, view, or other factors that are the cause of the variance.
So I need more data. Well, while Rollingwood is a premium area, the general Westlake area (shown below) is also a similar area.

So let’s search for all homes in this area and see what we get. From the 146 results:
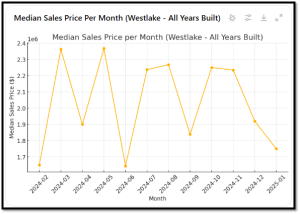
Pretty big difference here also. Probably a result of the same, with older homes being razed for new, larger construction. So let’s limit the data set to only homes built prior to 1980 again. This returned 43 total results.
Based on this, and my comparable sale from last May, should I make an upward Date of Sale adjustment of 35% ($1.3M in May vs current $2M)? Probably not.
To summarize:
- Rollingwood “all data” says make a negative 46% adjustment.
- Rollingwood “pre-1980 data” says make a negative 26% adjustment.
- “All of Westlake data” says make a 26% negative adjustment.
- “All of Westlake pre-1980’s data” says a positive 35% adjustment.
And common sense tells me none of this is correct.
So what do I do? Should I spread out farther? Capture a larger data set from more far-flung areas, even though they are different markets and may not be as relevant? Should I trim the data set down to reflect more similar properties (based on GLA and lot size, etc) to the point where I have no reasonably sized data set? Should I just use data from the general Austin MSA and assume that the particularities of the sub-market I am working in are not relevant?
Here is a graph of all sales in Austin that were within 500sf of mine (GLA), on .3-1 acre, built prior to 1980. That gave me a total of 214 results.
Still a very wide array and IMO not useful. It’s likely that there were a lot of lower-priced sales (in lower-priced areas) which are skewing the data. Here is a map of where they are located.

IMO, a lot of different market areas represented.
There are no good solutions to this conundrum.
Here is what I have historically done. I use the broader area (in this case Austin market area 8E which covers all of Westlake), look at two years of data, and reduce the data based on GLA and lot size to something relatively similar to my property, but at the same time making sure I have at least 25 or more data points. I’ve also eliminated waterfront properties. This is what that gives me.
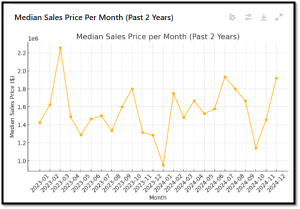
Still ugly. Based on this and the new GSE rules, I would need to make a 16% positive adjustment for my May of 2024 comparable ($1.6M then vs $1.9M now).
However, if I look at this data on an ANNUAL basis, here is what I get:
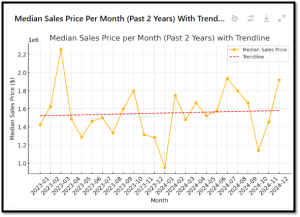
The trendline tells me that from January of 2024 through January of 2025, the median sales price trend goes from about $1.570,000 to $1,590,000; about a 1.5% annual increase. THIS MAKES SENSE.
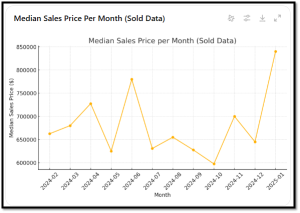
I’m going to run through this process again in a more homogenous area, Hutto, TX. This chart represents all sales in Hutto built since 1990 and on less than .3 acres. There were 815 results.
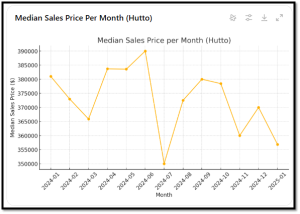
Hutto is a pretty homogenous area, and with a lot of sales, so my hope is that this may be slightly more meaningful. In my prior example, I was trying to determine an adjustment against a comparable sale from last May. According to this, the median sales price in May was $383,000, while currently it is $356,000. That is a 9% drop.
However, using a trendline, prices have declined from about $380,000 to $365,000 over the past year, a 4% drop.
Just for fun, I dropped this data into Chat GPT and asked it if it thought prices had increased or decreased, and to consider SF, Lot size, and Age when making the determination. Here is the response:

So what is the answer? As always in the appraisal field, “it depends”.
In my opinion, the GSE’s are asking for data that we can’t provide, at least in any reasonable, meaningful way. I’ve never been a big fan of paired sales, because comparing one house vs. another and assuming that the price difference is based on only one item (3rd garage stall, or a fireplace, or extra bathroom) doesn’t account for the vagaries of buyers. In a 1-vs-1 scenario, it might be the paint color in the dining room, or the cabinet hardware in the kitchen, or the proximity to a family member or work. That is why I work with group data analysis (larger data sets) to tease out adjustments. To make these new required adjustments on a monthly basis, you would really have to find a set of almost perfect model matches spread over a 12-month period, with multiple sales in each period. Assume that the minimum data set over that time is about 30 sales. You would realistically have to go through each of those sales and adjust for all other factors first (lot size, SF, condition, bath counts, views, etc) and then use the remaining values to calculate Date of Sale. Could it be done? Yes, if you have 10-15 hours per report. But is it reasonable? I don’t think so. My two cents is that the market, assuming no major inflection points (sudden substantial change in interest rates, war, disasters, and similar) lumbers on like an aircraft carrier; it doesn’t turn on a dime, and so tracking the rate of appreciation (or depreciation) over an extended period is a reasonable methodology.
UPDATE: I just watched the presentation from True Footage on their “True Tracts” product. It’s pretty neat, in that it (somehow) analyzes and adjusts for more distant markets – outside of what I would consider a reasonable market area – and uses that additional data to make more informed calculations. For example, in my earlier example of the home in Rollingwood, where I would extend the search area to Westlake, they may also consider Barton Creek, or homes north or east of Lake Austin or possibly Spanish Oaks and Lakeway subdivisions. To me those are very different markets, but they are crunching the numbers and saying they are similar. They also use that data to provide additional info for the report such as Page 1 trends, pre-written statements, 1004MC (if you still do that), and others.
I don’t know what that product is going to cost, but after the free period it will definitely cost something. It may be worth it to you, so check it out.
GSE rules require us to have something in our reports that explains why we made an adjustment, as well as why we DIDN’T make an adjustment. We can no longer just say, “no Date of Sale adjustment was necessary”, or even, “based on an analysis of sales in this area over the past 12 months, no Date of Sale adjustment was necessary.” You need to show your work, and I have no doubt they will be checking it. And of course, using our data to perfect their own in-house models…